| Home | Claude Code | HTTP API | Development |
A real-time desktop widget that tracks what your AI coding agents are doing.
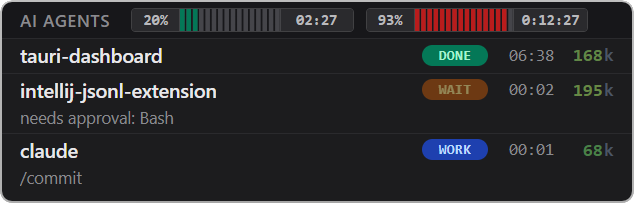
Anything that can POST JSON to localhost can report status. Each session appears as a row in a compact always-on-top window, with a state pill that transitions between WORK / WAIT / IDLE / DONE / ERROR, a live timer, and a token counter colored by how close the session is to its context limit.
Install
Download the latest AI Agent Dashboard_<version>_x64-setup.exe from the Releases page and run it. Windows 10 version 1803 or newer. WebView2 is fetched automatically during install if missing.
After installation, configure the agents you want to track:
Claude Code
First-class integration via lifecycle hooks in ~/.claude/settings.json. Each Claude Code session becomes a row named after its working directory, with state tracked through SessionStart / UserPromptSubmit / Notification / Stop / SessionEnd events. A transcript watcher tails each session’s JSONL to update token counts live between hook firings.
HTTP API
A generic POST endpoint — any tool, language, or CI script that can send JSON can report status. A three-line curl is enough, and the payload format is the same as Claude Code’s.
Usage
- Launch the widget — it lives in the system tray; left-click the tray icon to show or hide the window.
- Wire your agent of choice by following the Claude Code or HTTP API guide.
- Start a session — the first POST creates a row, status transitions animate the pill, and
clearremoves the row when a session ends.
Settings
All settings live in config.json under the app data directory (%APPDATA%\com.anothersava.ai-agent-dashboard\ on Windows). The tray menu has an “Open config/logs location” shortcut that opens the folder, and the widget hot-reloads config.json on save — no restart needed except when changing the HTTP server port.