A plugin for every IntelliJ-based IDE (IDEA, PyCharm, WebStorm, Rider, GoLand, CLion, DataGrip, RubyMine, RustRover, PhpStorm) that renders .jsonl (JSON-per-line) structured log files in human-readable form, with highly customizable visualization and a range of filters.
Example
Given an entry like:
{
  "timestamp": "2026-04-22T21:43:38.033084Z",
  "level": "DEBUG",
  "fields": {
    "message": "event -> clear",
    "client": "claude",
    "event": "SessionEnd",
    "chat_id": "zed-ext"
  },
  "target": "ai_agent_dashboard_lib::http_server"
}
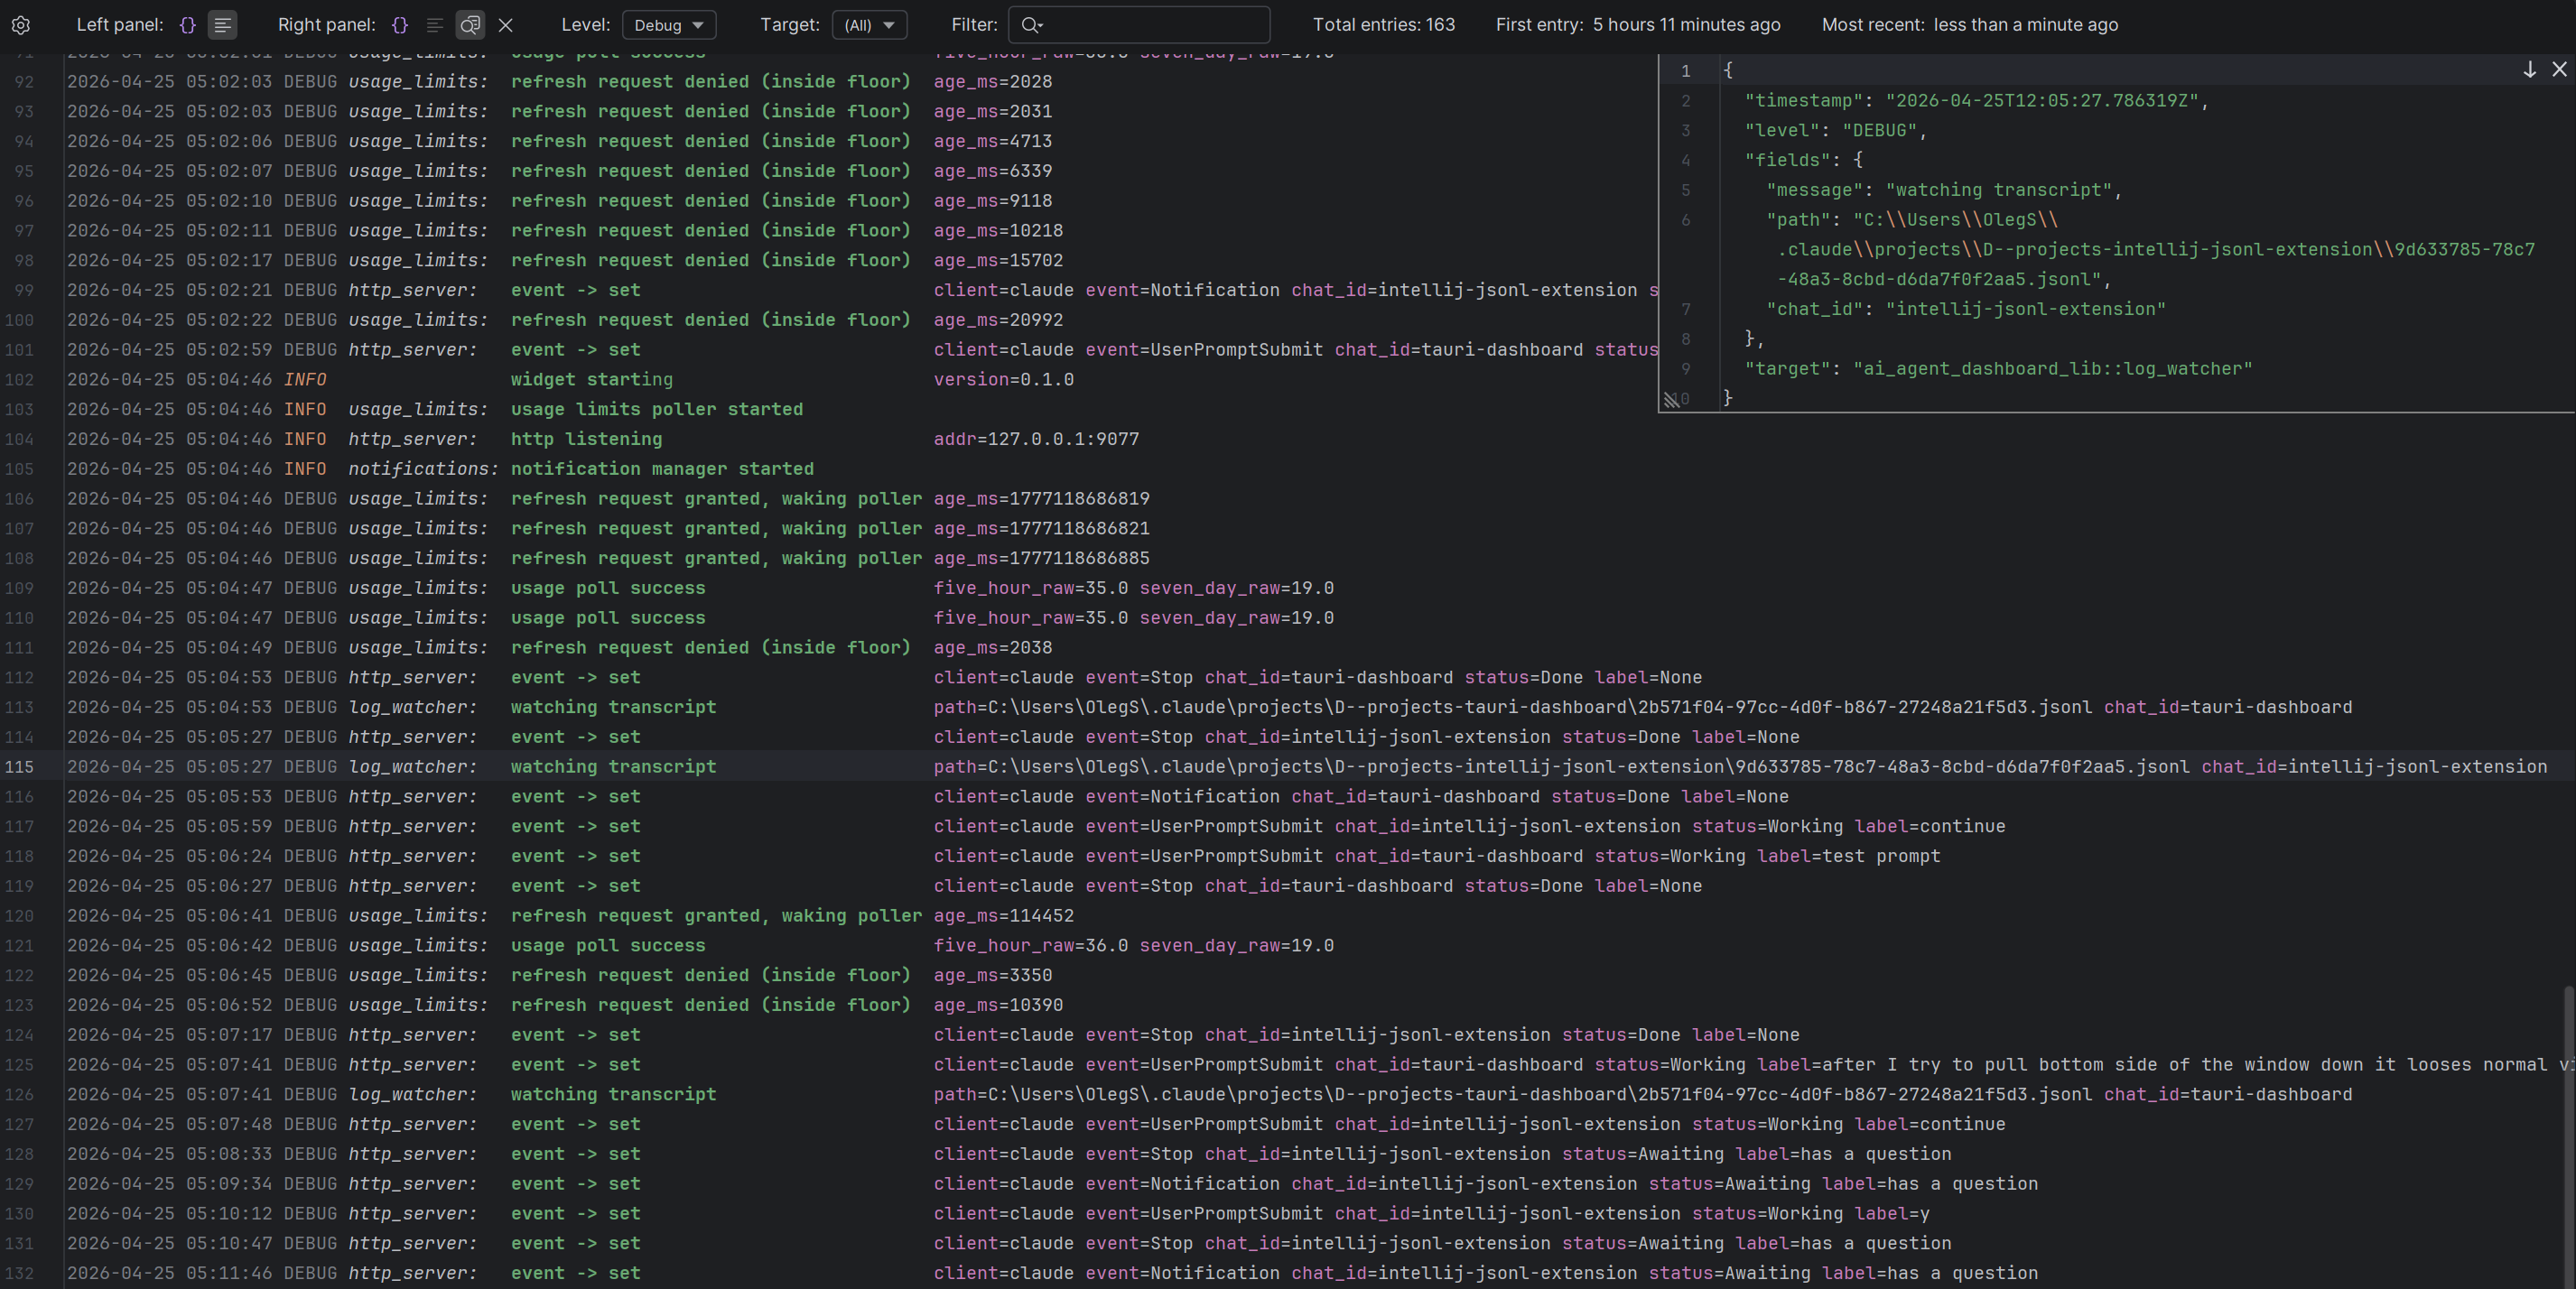
the plugin displays it as:
2026-04-22 21:43:38 DEBUG http_server: event -> clear client=claude event=SessionEnd chat_id=zed-extFeatures
- Single or dual panel view — show Raw and Formatted log lines side-by-side, or focus on one full-width
- JSON inspector overlay — caret-driven floating overlay that pretty-prints the entry under the cursor
- Per-element styling — coloured severity, italic target, bold message, tinted field keys, dimmed timestamp and
= - Customizable colours — ten colour keys exposed through the IDE’s standard Color Scheme editor
- Aligned columns — option to align targets, messages, and fields for improved readability
- Smart value rendering — strip the common target prefix, un-wrap Rust Debug
Some(...)literals, un-escape debug-quoted strings - Three composable filters — severity, target, substring
- Live stats — matching entries, first and most recent timestamps
- Custom field mapping — defaults to Rust tracing; adapts to pino, Serilog, bunyan, OpenTelemetry, or any other format via five dotted paths
- Settings menu — quick toggles for every rendering option
Install
Build the plugin from source — see the Developer guide for JDK / Gradle prerequisites and the install-from-disk workflow.
Next steps
- Usage — pane layouts, filter behaviour, the Inspect overlay, gear popup, settings page, Color Scheme integration, and field-mapping reference for non-Rust log formats
- Developer guide — building from source, running tests, debugging in a sandbox IDE